Arrange a report
Organise a report into sections and rows, resize widgets, drag them into place, or edit the page layout directly.
You will arrange a report page: add sections, choose row heights, drag widgets and resize them.
Before you start: editing needs Full control on Analytics & reports. Open the report and click Edit report.
How a page is built
A report is made of sections. A section holds rows. A row holds up to twelve columns of widgets side by side, and every widget in a row has the same height, so cards line up.
| Row height | Holds | Max widgets |
|---|---|---|
| KPI row | Headline numbers and notes | 6 |
| Chart row | Charts, tables, notes, forms | 4 |
| Table row | Charts, tables, notes, forms | 4 |
| Auto height | Charts, tables, notes, forms | 4 |
| Actions | Buttons only | 8 |
Widths add up to 12 columns. A chart or table must be at least 3 columns wide. A report can hold up to 10 sections and 40 rows.
Steps
- Click Edit report. The header becomes a compact bar with Report name, Tags, Edit layout XML, Add section, Add widget and Done.
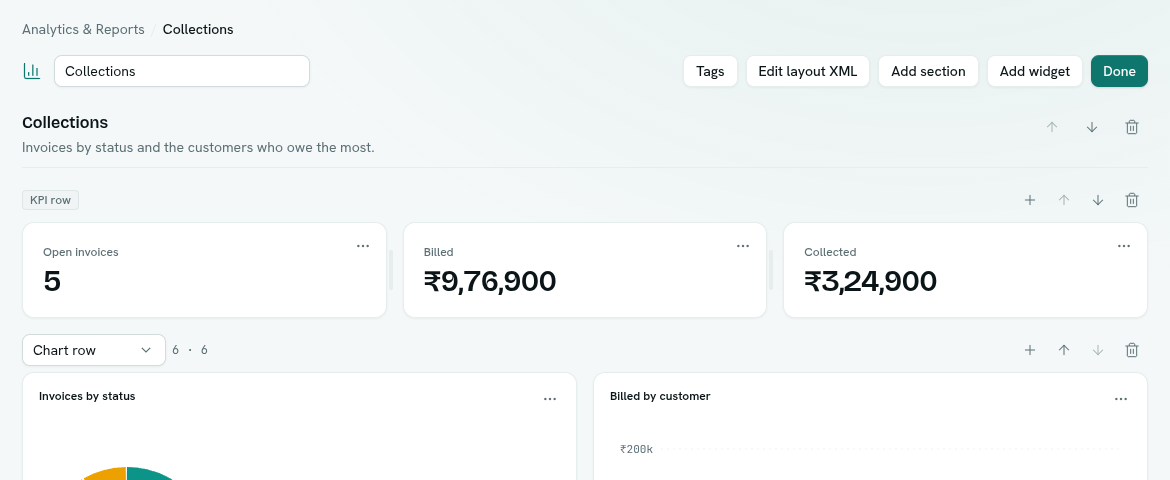
- Sections: click Add section. Type a Section title (optional) and One line of context (optional). Use Move section up, Move section down and Remove section. Titles can be 80 characters and descriptions 240.
- Rows: each row has a toolbar. Use the height menu (Row height) to switch between the heights its widgets fit. Use Add a widget to this row, Move row up, Move row down and Remove row.
- Move a widget: pick it up anywhere and drop it before or after another widget. Only rows that can hold that kind of widget accept it, and a full row refuses more. Drag it onto another section to move it there. An empty section says Empty section and offers Add widget.
- Resize: drag the border between two widgets in a row. Widths snap to twelfths and show "6 / 6 of 12" while you drag.
- Widget menu: the Widget options button gives Configure…, Edit query and Remove. See Widgets.
- Click Done to return to reading mode. Every change is saved as you make it.
Edit the layout as text
Click Edit layout XML to see the page as text. It shows errors as you type and Apply is only enabled when the layout is valid. The help line reads: sections hold rows; each row is kpi, chart, table or auto height; the w of its widgets adds up to 12, or is left out for an even split. This is the same format Ask Axis writes when it builds a page for you.
Time range
When any widget's query uses the date range variables, a Time range picker appears in the header. In edit mode changing it sets the report's default range. See Variables and time range.
Reading mode
Reading mode is the default view. It shows the title, tags, a one-line description, Refreshed time and a Refresh data button that re-runs every widget. Only people with edit permission see Edit report.
Tips
- Put four headline numbers in a KPI row, then a wide chart beside a donut, then tables underneath.
- If a drop does not land, the row is either full or does not accept that widget kind.
Troubleshooting
a kpi row holds at most 6 widgets (got 7) — split it Layout checks name every problem. Remove a widget or move it to another row.
Table is missing from the Visualisation menu Tables are not offered in a KPI row. Move the widget to a chart, table or auto row first.