Analytics & Reports
Turn your live workspace data into reports: pages of tables, charts and headline numbers, built from SQL queries or from plain-English questions.
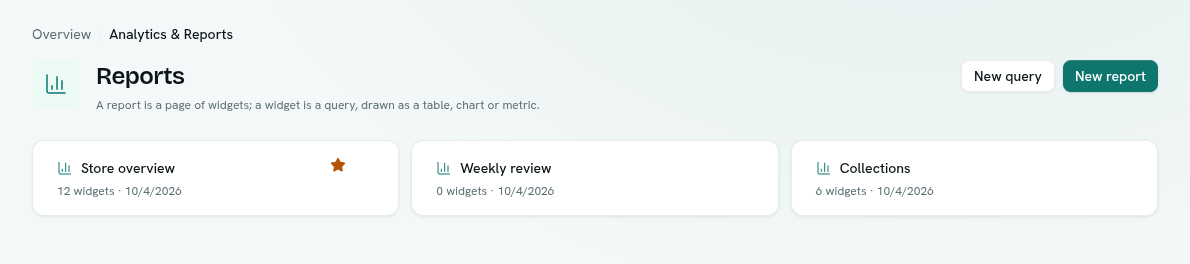
Analytics & Reports answers questions about your business from your live data. A report is a page of widgets. A widget is a query drawn as a table, a chart or a headline number. You can write queries in SQL, have AI write them from a plain-English description, save the ones you reuse, and even query other databases alongside your workspace.
What you can do
- Build a report page — name it, add widgets, arrange them. Create a report
- Choose what a widget shows — chart, table, headline number, note, form or button. Widgets
- Arrange the page — sections, rows, widths and drag-and-drop. Arrange a report
- Find your reports fast — star favourites, pick a home page, file by tags. Favourites, home page and tags
- Write and run queries — the full-screen workspace with AI help, results, CSV and Sheets export. Query workspace
- Know the SQL rules — what is allowed, the 1,000-row cap, meaning-based search. SQL rules and limits
- Reuse a query — keep it in the library and pin it to reports. Saved queries
- Let viewers choose dates — variables and the report time range. Variables and time range
- See how big your data is — storage, and speed-up indexes. Storage and indexes
- Query other databases — MySQL, PostgreSQL, MongoDB, SAP HANA or a JSON API. Data sources
Before you start
- Who can use it: the Analytics & reports app on the Roles page. Can query & read lets you open reports, run queries and see only the data you may already read. Full control adds creating, editing and deleting reports and saved queries for everyone, adding indexes, and connecting data sources.
- Analytics cannot be switched off in Settings › Apps.
- Your workspace's own data is already queryable. For other databases you first add a connection.
Where to find it
Launcher category Intelligence › Analytics & Reports. The left rail has:
- Reports — your report pages as cards.
- Saved queries — the reusable query library.
- Query workspace — the full-screen SQL tool.
- Data sources — connections to other databases.
Key ideas
| Term | What it means |
|---|---|
| Query | One read-only SQL SELECT statement. |
| Report | A page of widgets, in sections and rows. |
| Widget | A query drawn as a table, chart or metric. Notes, forms and buttons are widgets too. |
| Saved query | A query kept in the library so many reports can pin it. |
| Home page | The report you see on your dashboard instead of the standard console. |
| Tag | A label used to group reports. A report can carry many. |
Related
- Ask Axis can run queries and build report pages for you.
- Sheets — open a result in a spreadsheet.
- Knowledge Base