Query workspace
Write or generate a query, run it, switch between table and chart views, save it, export it or open it in Sheets.
The query workspace is a full-screen tool for asking your data questions. You can write SQL yourself or describe what you want in plain English.
Before you start: you need Can query & read on Analytics & reports. Saving a query needs Full control. You only ever see data your role may read.
Open it
- Analytics & Reports › Query workspace, or New query on the Reports and Saved queries pages.
- From a report: Add widget › Chart, table or metric › Write the query, or Edit query on an existing widget. The workspace then adds or updates that report's widget.
- From a saved query card: open it to edit it.
Use Back to Analytics (top left) to leave. On a phone the Tables button opens the table list as a drawer.
Run a query
- Type SQL into the editor, or pick a table on the left. The first run shows an empty-state hint: "Describe a report, pick a table on the left, or write SQL — then run it. Reserved words like
orderneed backticks." - Click Run or press
Ctrl + Enter(⌘ + Enteron a Mac). Run is the only button with that shortcut.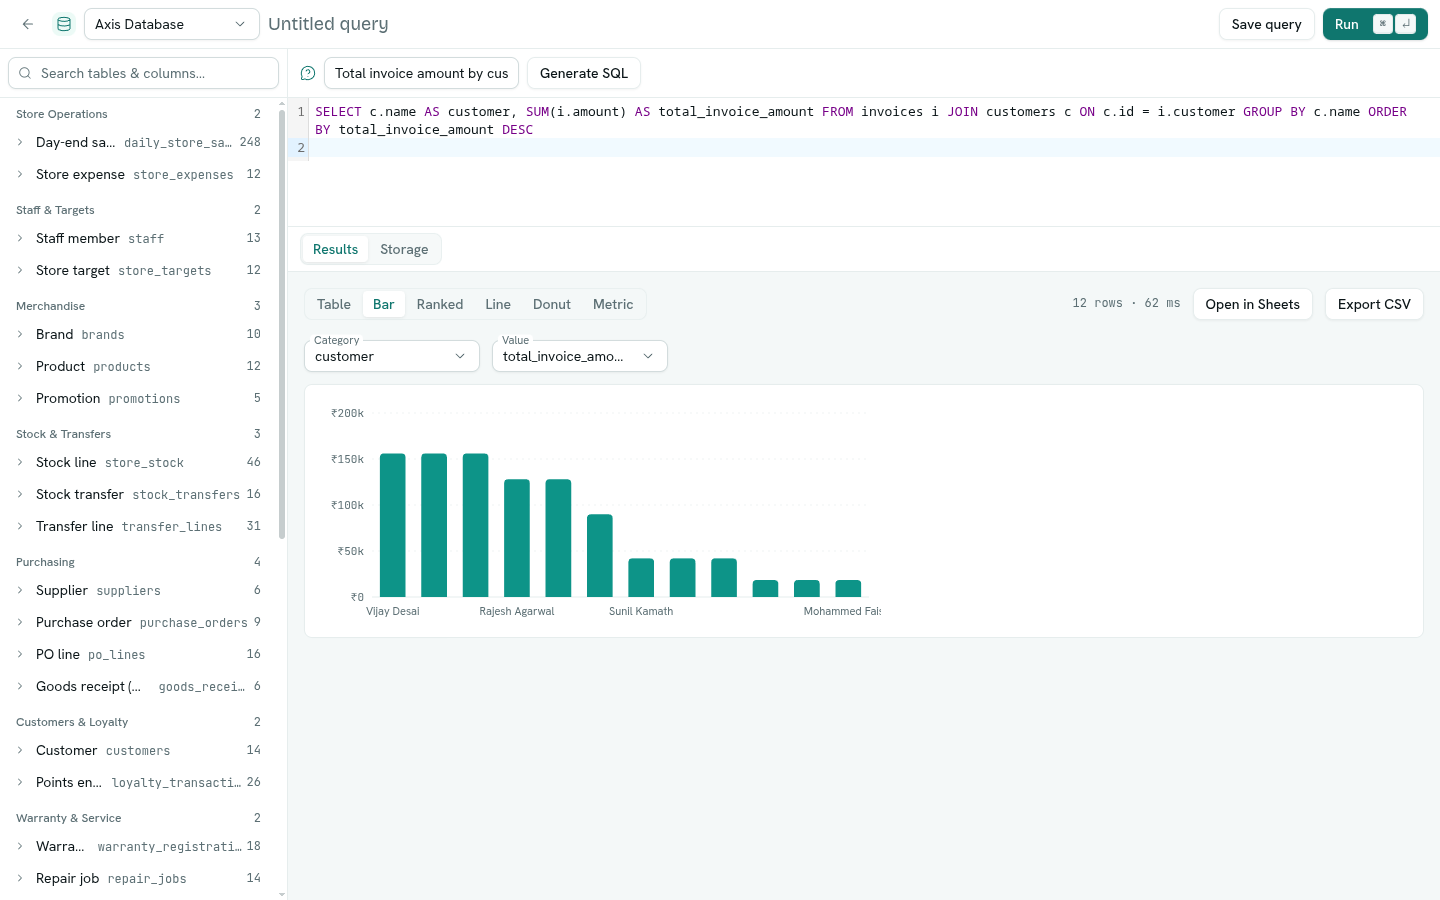
- The results show below with the number of rows and how long it took. A capped at 1,000 badge means the result was cut at 1,000 rows. See SQL rules and limits.
Generate SQL with AI
- In the bar above the editor type what you want in the box Describe the query in plain English — press Enter to generate SQL. For example: "Total invoice amount by customer this year".
- Press Enter or click Generate SQL.
- The SQL is placed in the editor and runs. Always read it before you trust the numbers; you can edit it and run again.
AI assist is only shown for your workspace data, not for external data sources. It uses the data you are allowed to see, and AI use counts against your plan.
Choose how results look
Above the results, the Result view switcher offers Table, Bar, Ranked, Line, Donut and Metric, depending on the shape of the result. For charts, pick the Category and Value columns. For Metric with many rows, pick the Value column, a Headline (Sum, Last, Average, Minimum, Maximum) and Compare (Previous period or No comparison).
Explore the schema
The left rail lists your tables, grouped by the app that owns them, then Custom objects, then System tables. Use Search tables & columns… to filter. Expand a table to see its columns; click it to open the table details. Database size at the bottom opens the Storage view. See Storage and indexes.
Save, add to a report, export
- Query name (top bar, "Untitled query") names what you are working on. Give it a name before saving: "Give the query a name before saving."
- Save query keeps it in the library (Update saved query once it exists). See Saved queries. You see "Query saved".
- When you came from a report, the main button is Add to report (or Update widget) and Also save as query is optional.
- Export CSV downloads the shown rows as
analytics-result.csv.
Open in Sheets
Click Open in Sheets above the results to turn the result into a spreadsheet workbook and jump to it. The button needs at least one row and is not offered for external data sources.
- If your query reads one record type and selects its
idcolumn, the sheet is linked to those records, so you can edit and push changes back. - Otherwise it is a one-time snapshot, and you see "Snapshot only — link needs a single-table query selecting id".
- You need access to the Sheets app. See Sheets.
Another source
If your workspace has data sources, a Data source menu in the top bar lets you switch from Axis Database to a connected source. See Data sources.
Troubleshooting
only a single read-only SELECT statement is allowed
Only SELECT queries run here. See SQL rules and limits.
query references a table that isn't available — use the listed tables only Use a table name from the left rail.
Nothing to add — generate or write a query first. / Nothing to save — generate or write a query first. The editor is empty.